Infographic - Sales Sheet
Project description
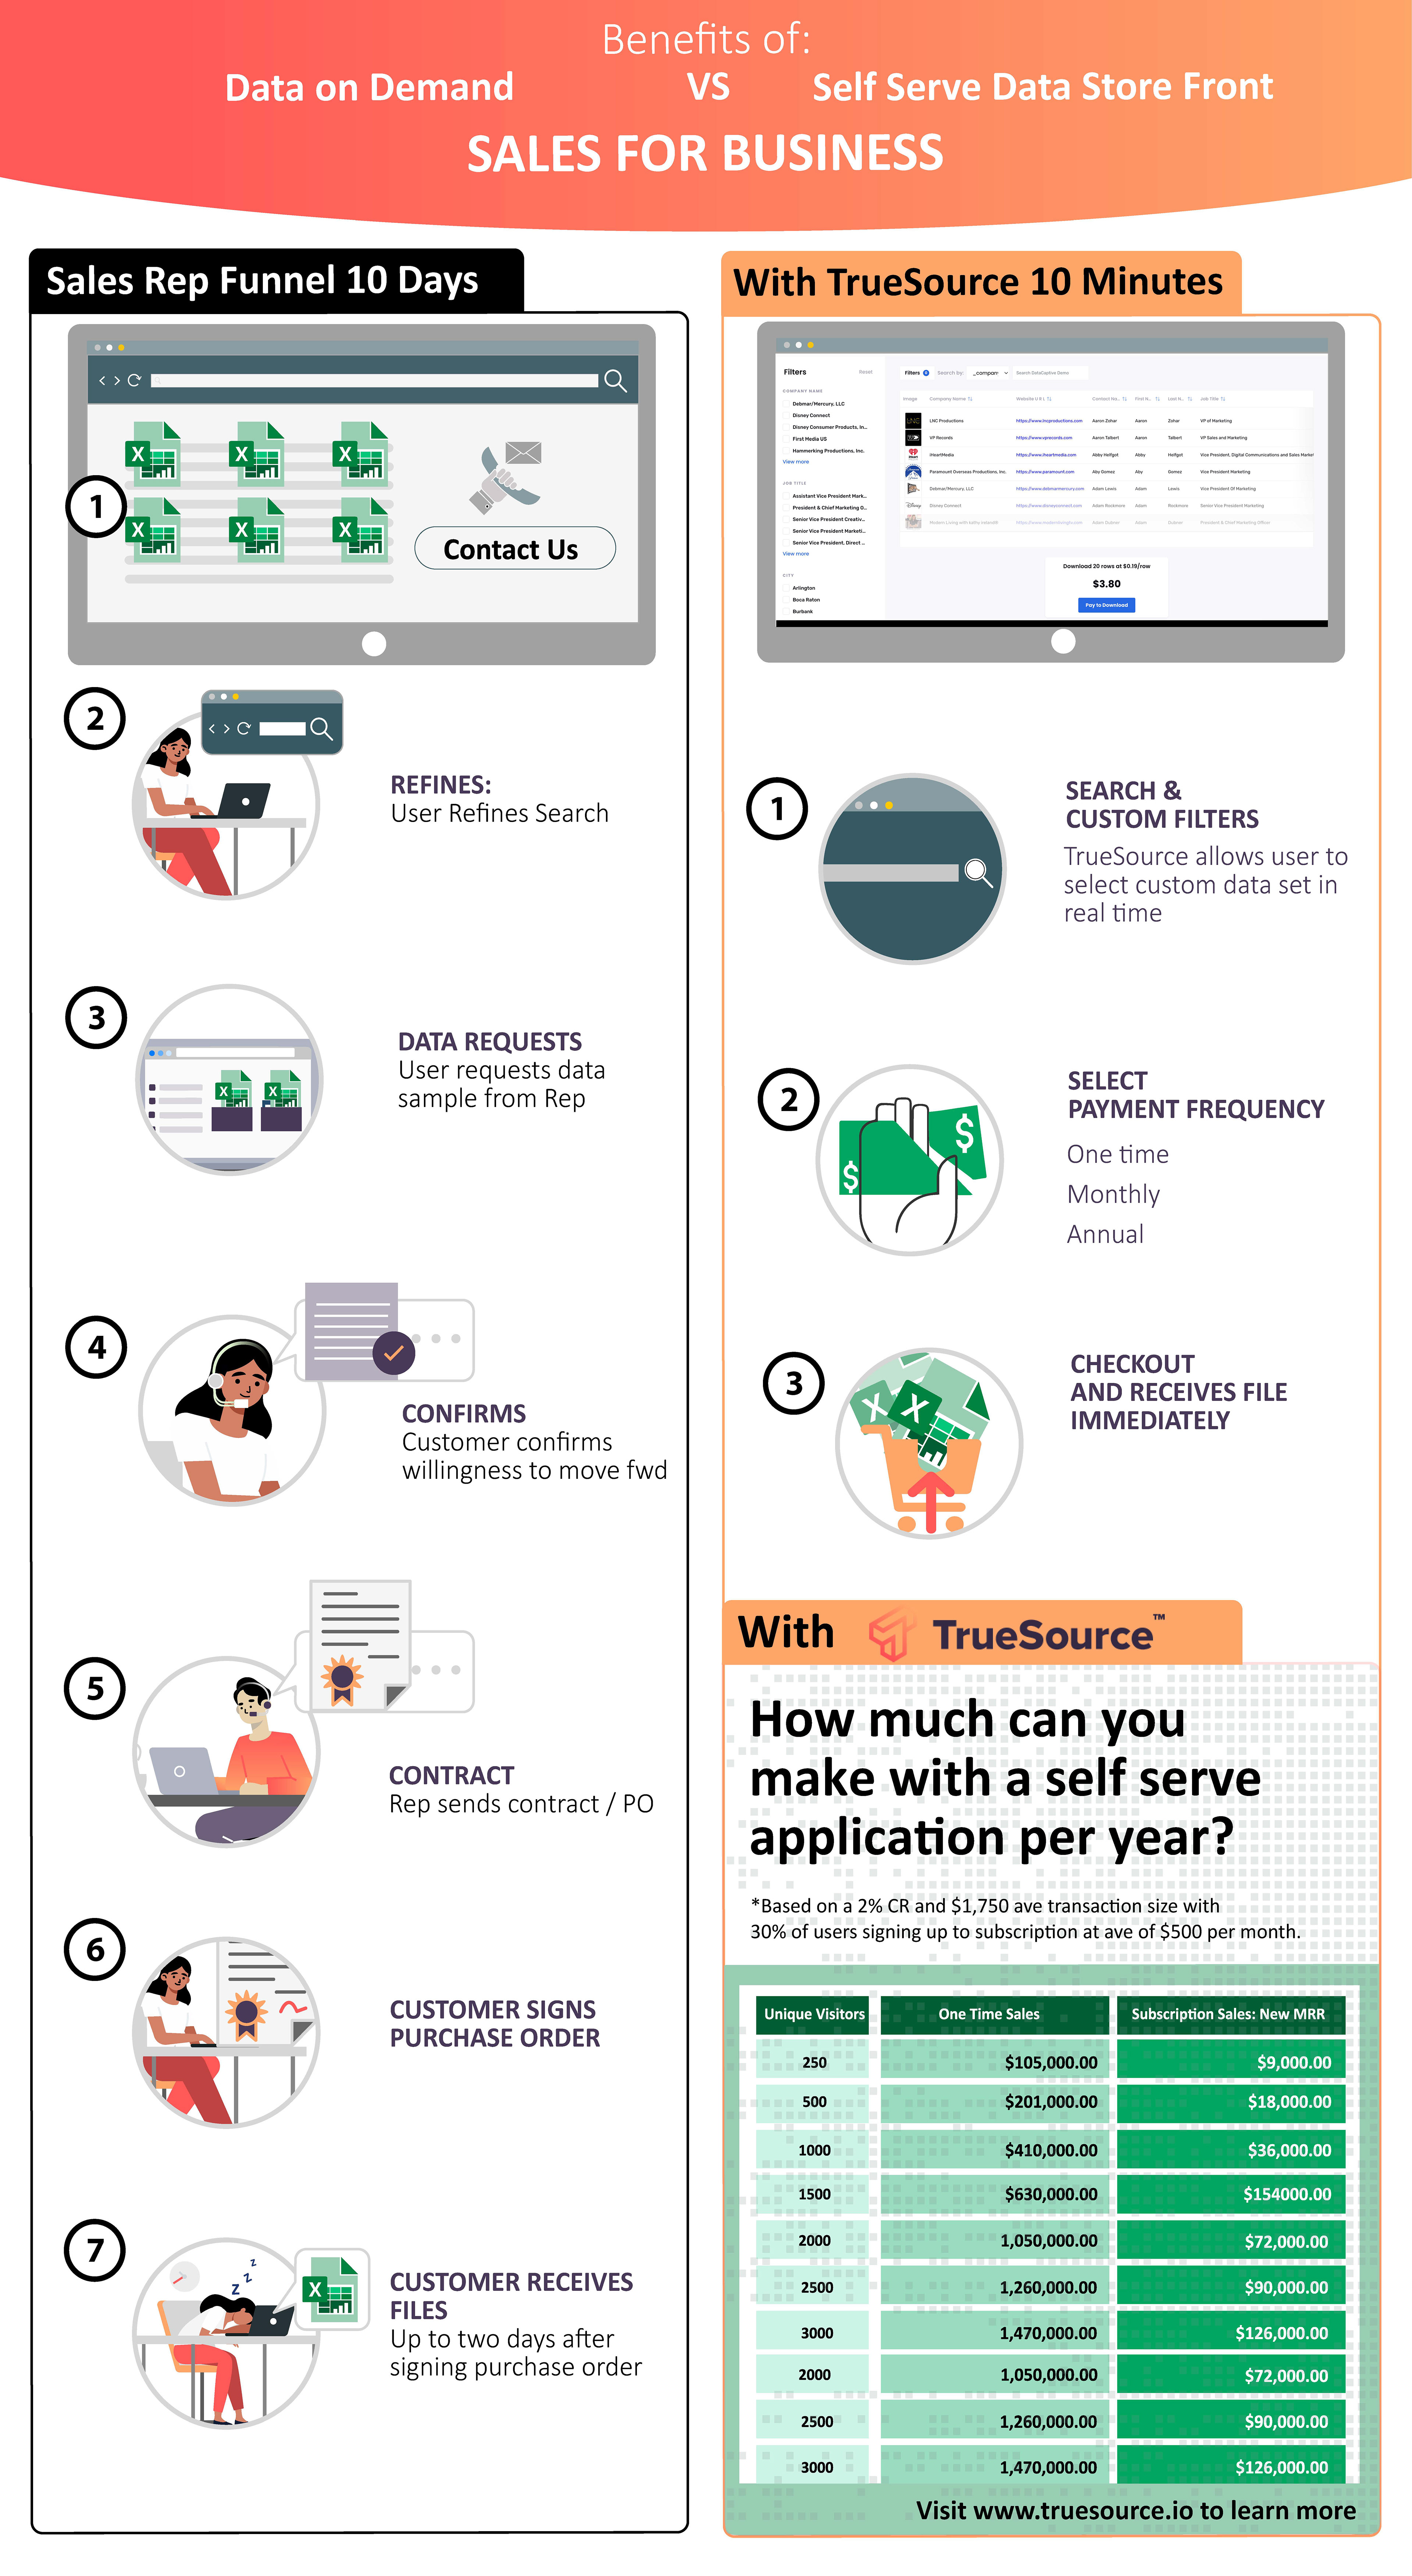
Looking for an infographic that shows the revenue benefits of eCommerce vs traditional sales for businesses in the data provider space. This should show two revenue scenarios.
1. call a sales rep
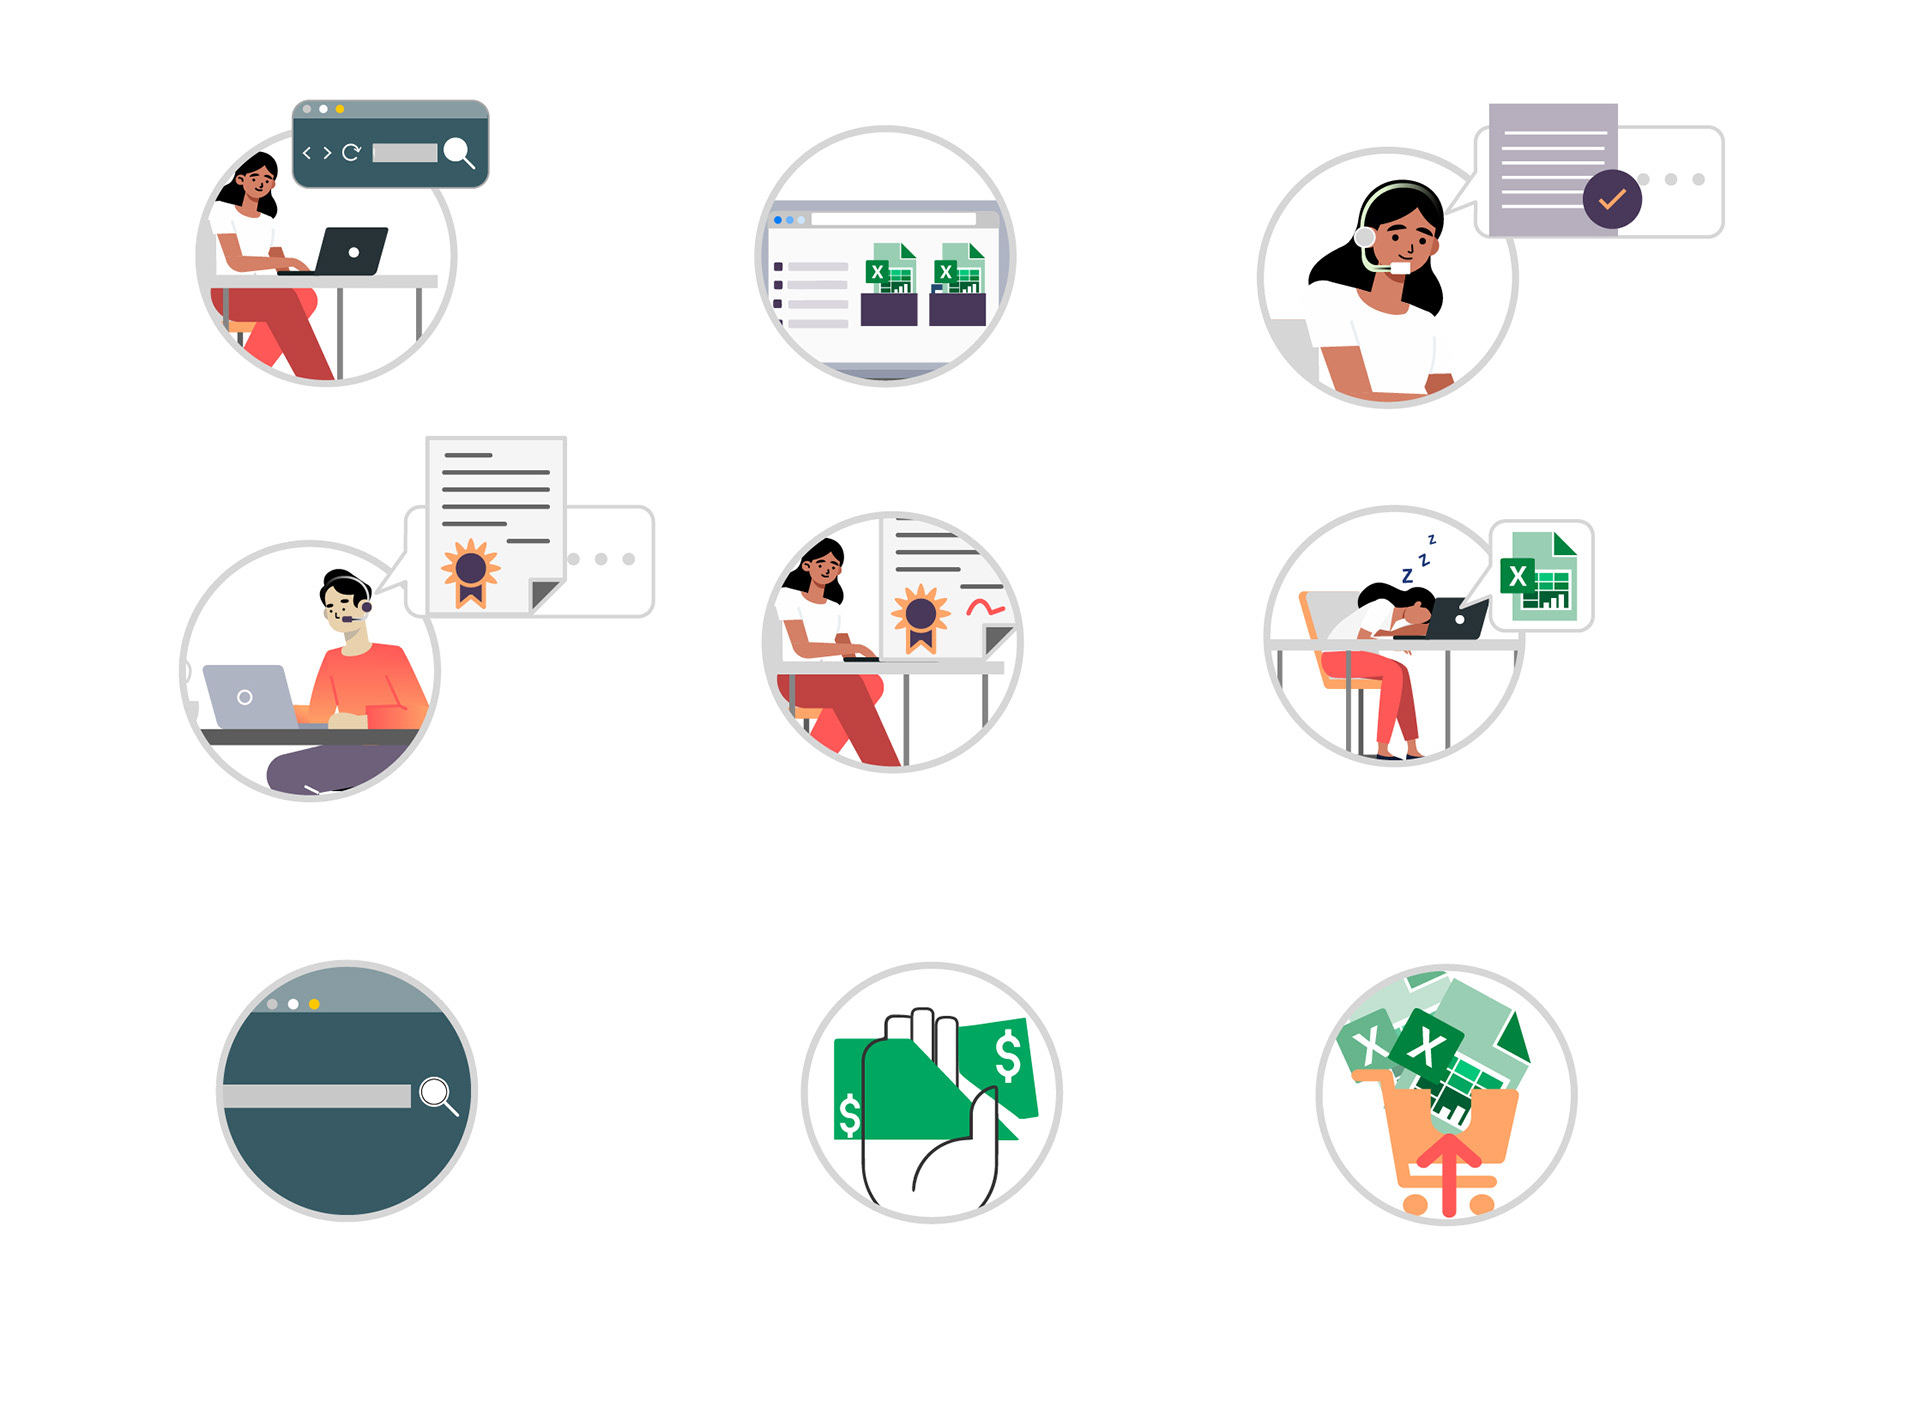
2. user refines the search
3. rep retrieves the data sample and sends
4. The customer confirms willingness to move fwd
5. Rep sends contract / PO 6. Customer signs. Number of days from first inquiry = 10